Statistics
Statistics
The Statistics section of the Dashboard allows you to clearly and segmentally visualize how the Daiana platform is used in your organization. It provides historical information, rankings, and customizable metrics to facilitate tracking usage, assistant performance, and user and team engagement.
Historical Podium
Shows a summary of the most used elements since the environment was activated:
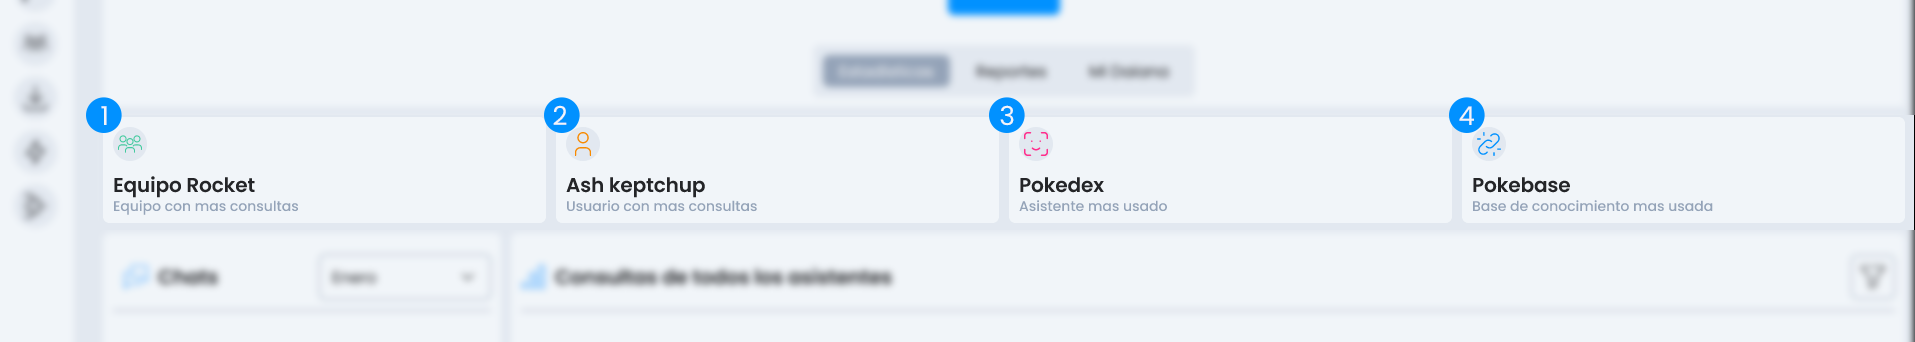
- Most active teams
- User with the highest number of interactions
- Most used assistant
- Most consulted knowledge base
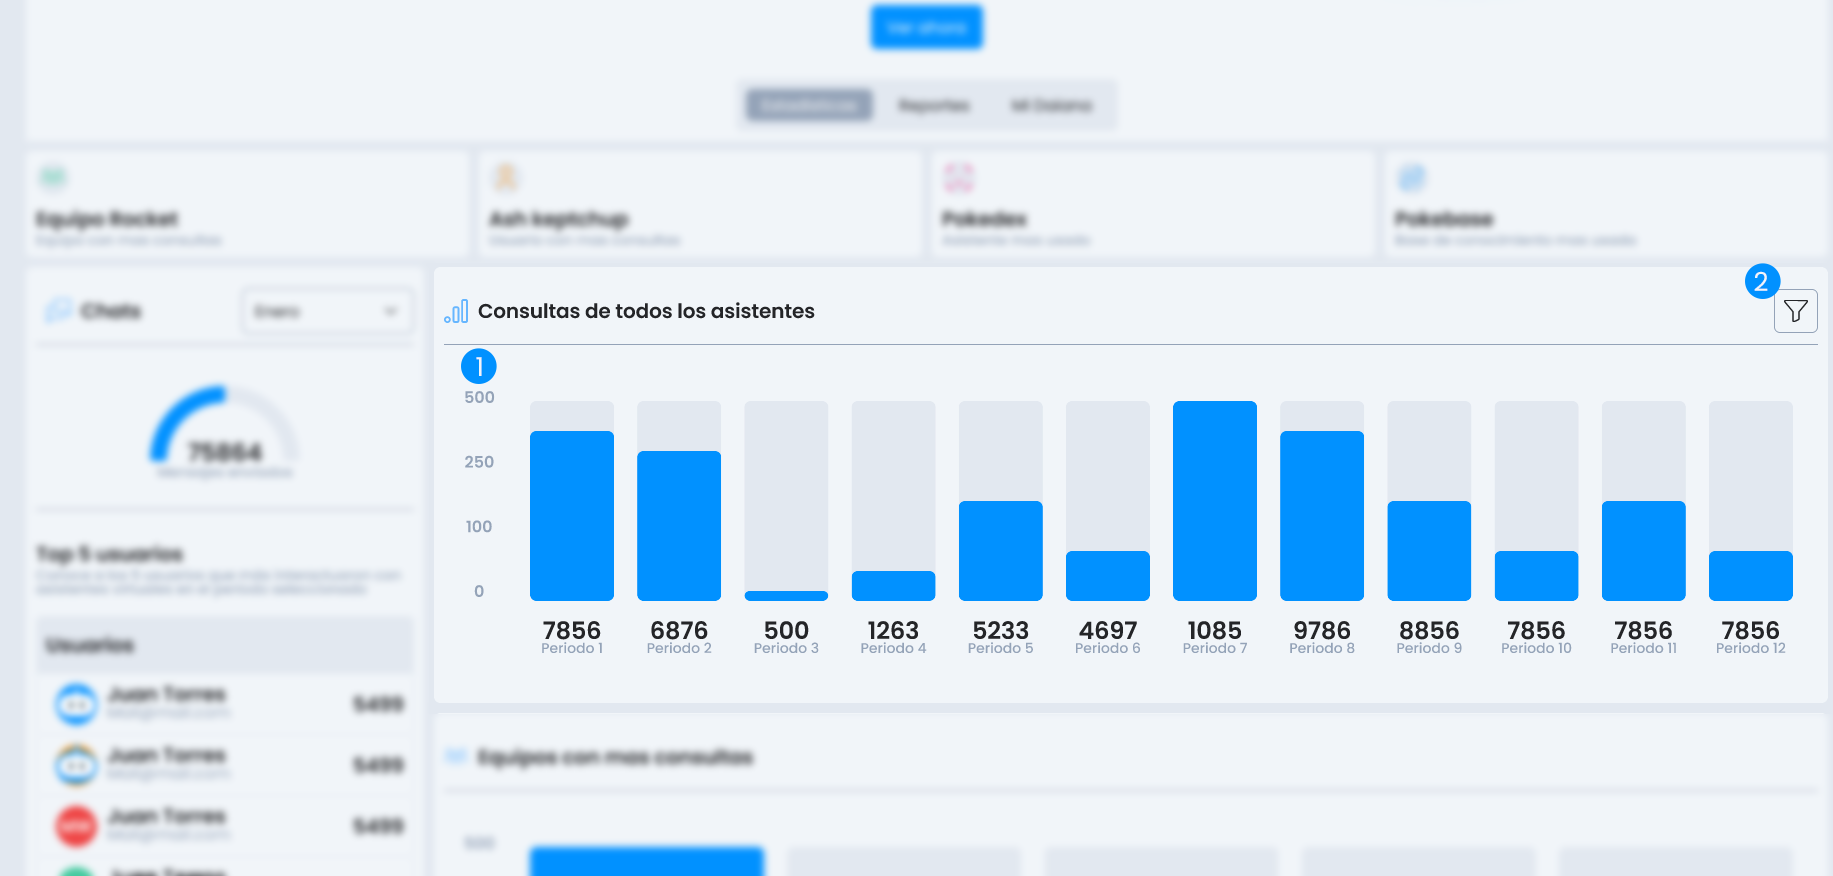
Monthly Ranking
![]()
- Filter: Filter by month to consult the ranking activity for that period.
- Total Submissions: Shows the total messages sent in the selected period.
- Top 5 users with most activity
- Top 5 most used assistants
Useful for evaluating recent adoption and month-to-month performance of agents and users.
All Assistant Queries
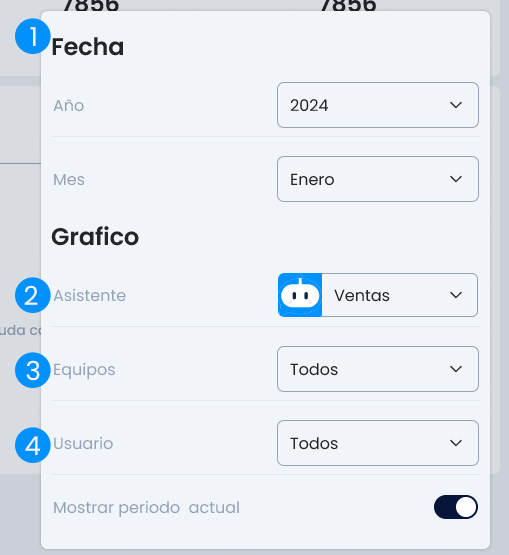
Graph showing the evolution of platform usage. Includes multiple filters for a personalized view:
- Filter
- Statistics
Filter
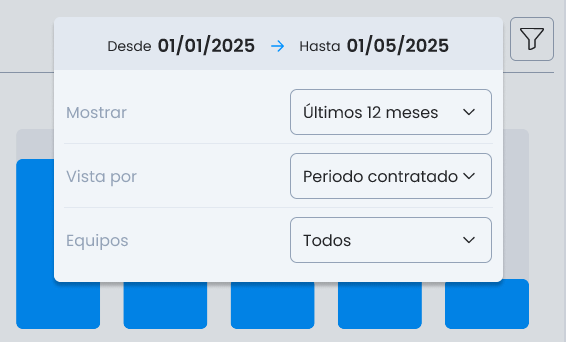
- Show: last 12 months, last 6 months, or specific period.
- View by: calendar month or contracted period.
- Teams: filter by one or more specific teams.
This section helps identify trends and seasonality, as well as measure the impact of new implementations.
Teams with most queries
Ranking of teams with the highest volume of use. Allows visualizing which areas or projects are making the most of Daiana's functionalities.
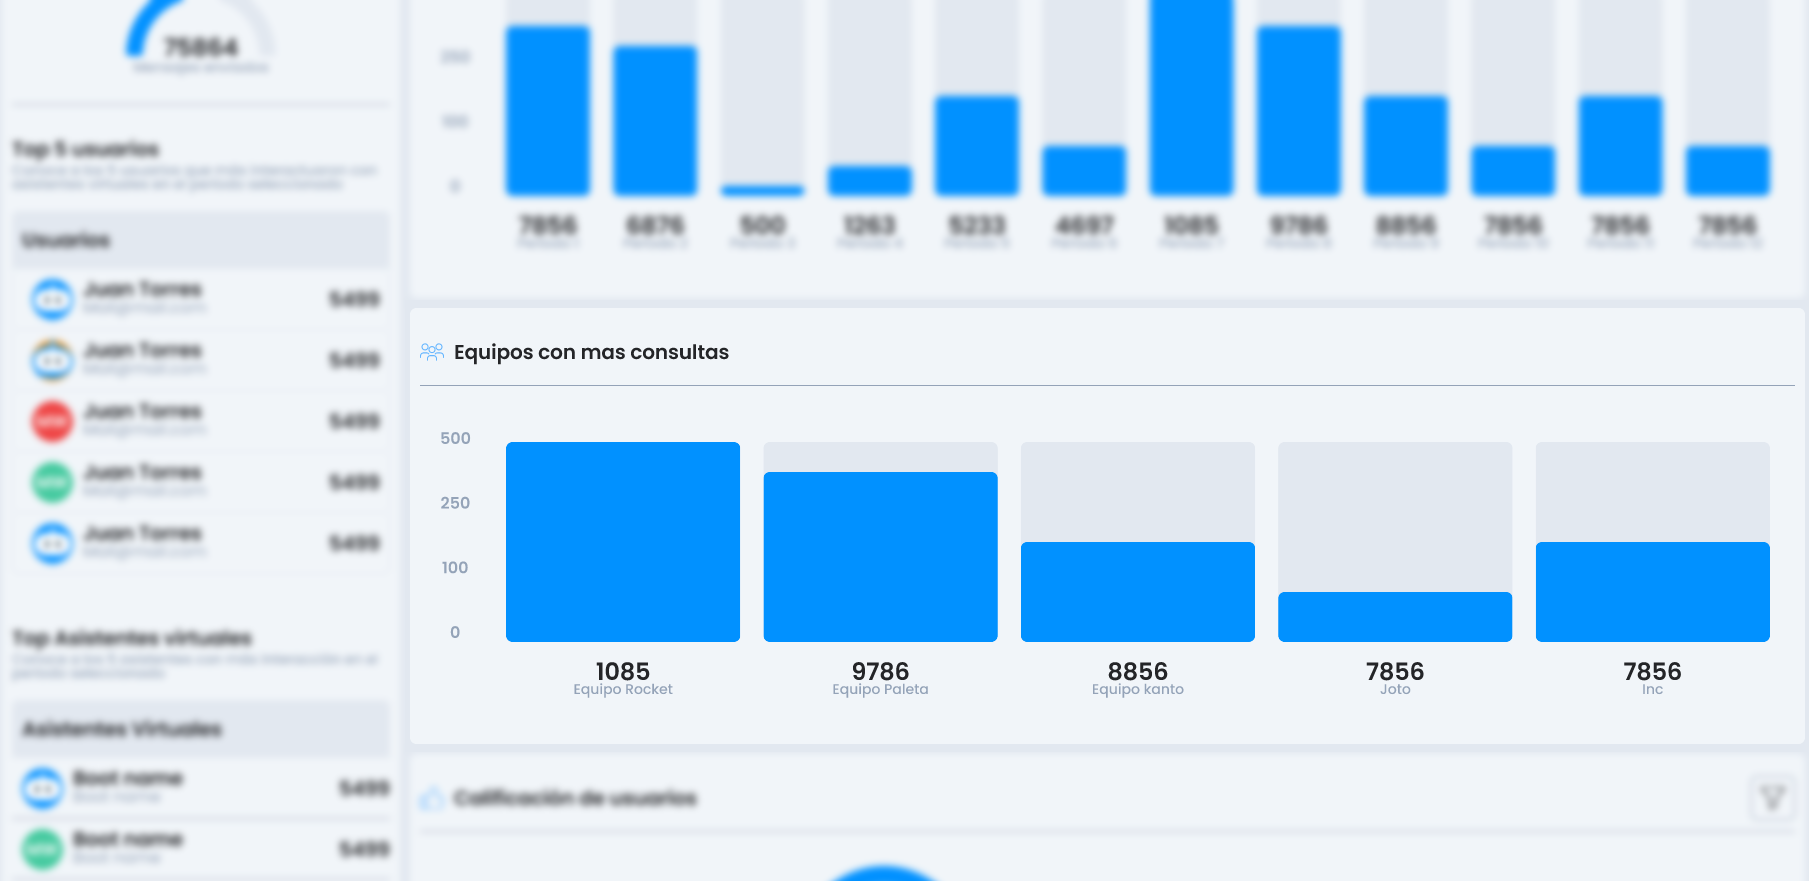
An excellent tool to foster healthy competition or direct training actions.
User Rating
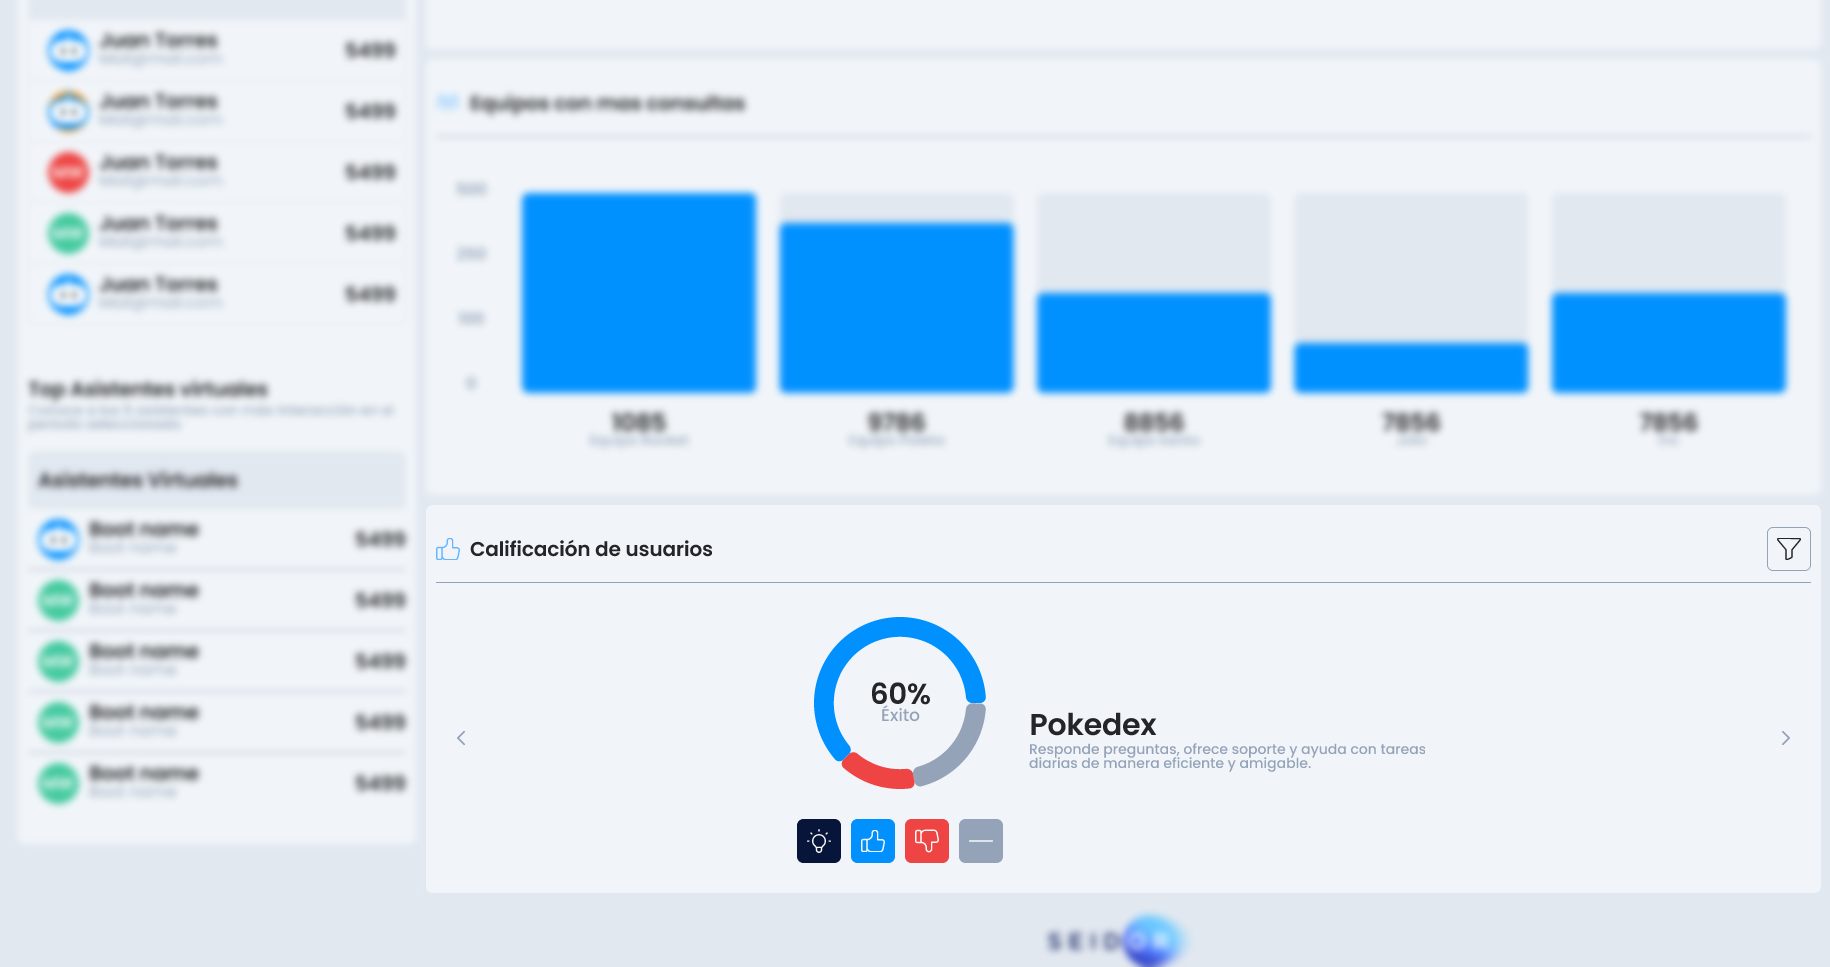
Module that collects end-user ratings on their interactions with assistants. Available filters:
Filters
- Date range
- Specific assistant
- Team
- User